
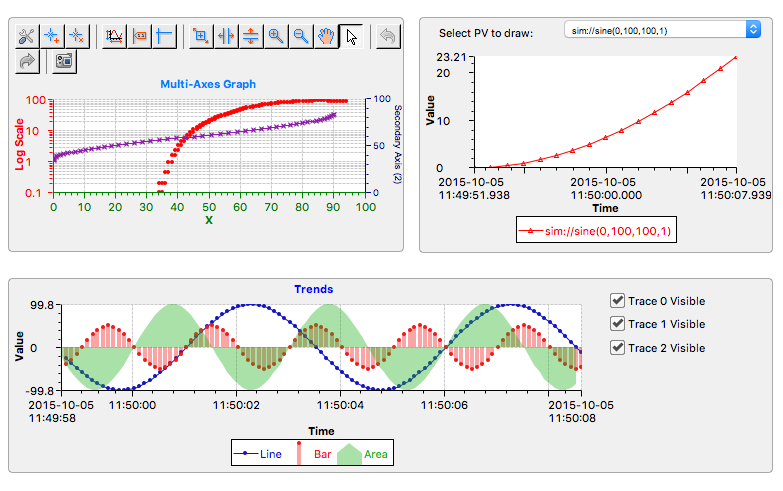
XY Graph
Widget for plotting one or two-dimensional data.
Basic Properties
- Name (
name) Human-readable name of this widget. Shown in the Outline view.
- PV Name (
pv_name) The name of the main PV for this widget. If set, the widget’s value follows value updates of the corresponding PV.
It is not a requirement to use a PV. You may also control the widget value directly through scripting.
- Widget Type (
widget_type) Readonly property describing the type of this widget.
Behavior Properties
- Actions (
actions) Executable Actions attached to this widget.
- Axis Count (
axis_count) The number of axis. Must be between 2 and 4. For each axis, a property group is added. The first axis is always considered the primary X axis. The second axis is always considered the primary Y axis. Up to two other axes may be added, whether they are X or Y is controlled with the Y Axis property of each secondary axis.
- Enabled (
enabled) Unset to make this control widget unusable.
- Rules (
rules) Rules attached to this widget.
- Scripts (
scripts) Scripts attached to this widget.
- Trace Count (
trace_count) The number of traces. For each trace, a property group is added.
- Trigger PV (
trigger_pv) PV that serves as the trigger for traces that have the property Update Mode set to
Trigger.
- Visible (
visible) Manage the visibility of this widget.
Border Properties
- Alarm Sensitive (
border_alarm_sensitive) If the PV is in alarm state, the widget border and style change to alarm mode.
- Border Color (
border_color) The color of the widget border.
Has no meaning with certain types of border styles (for example, raised borders have a fixed style).
- Border Style (
border_style) The type of border. Some border styles also colorize the background of the widget’s bounding box.
- Border Width (
border_width) The thickness of the widget border.
Has no meaning with certain types of border styles (for example, raised borders have a fixed style).
Display Properties
- Alarm Pulsing (
alarm_pulsing) If enabled, the PV is in alarm state, and the properties BackColor Alarm Sensitive and/or ForeColor Alarm Sensitive are used, then the corresponding colors will fade in and out to draw operator’s attention.
- BackColor Alarm Sensitive (
backcolor_alarm_sensitive) If the PV is in alarm state, then Background Color matches the corresponding alarm color.
- Background Color (
background_color) The color of the background of the widget’s bounding box. Only visible when the widget uses a border style that fills up the widget area.
- ForeColor Alarm Sensitive (
forecolor_alarm_sensitive) If the PV is in alarm state, then Foreground Color matches the corresponding alarm color.
- Foreground Color (
foreground_color) The color of the title.
- Plot Area Background Color (
plot_area_background_color) Background color used to colorize the plot area.
- Show Legend (
show_legend) Whether to show the trace legend.
- Show Plot Area Border (
show_plot_area_border) Whether to show a border around the plot area.
- Show Toolbar (
show_toolbar) Whether to show a toolbar with advanced controls.
- Title (
title) The title of the graph.
- Title Font (
title_font) The font used to render the title.
- Tooltip (
tooltip) Tooltip when mouse hovers this widget.
- Transparent (
transparent) If true, the unused part of the widget area is left transparent. If false, the unused part uses the Background Color.
Position Properties
- Height (
height) Height of the widget area in pixels.
- Scale Options (
scale_options) If autoscaling is enabled on the Display, then this property allows controlling whether and how this widget participates.
- Width (
width) Width of the widget area in pixels
- X (
x) X-coordinate in pixels of the top-left corner of the widget area.
- Y (
y) Y-coordinate in pixels of the top-left corner of the widget area.
Axis Properties
The property names for the following properties take the form
axis_x_property_name, where x is the zero-based index of that axis.
The first two axes are always the primary X and Y axis. Other axes are considered secondary and have additional properties Left/Bottom Side and Y Axis.
- Auto Scale (
axis_x_auto_scale) Whether to automatically adjust the scale of this axis.
- Auto Scale Threshold (
axis_x_auto_scale_threshold) Value in the range
[0-1]representing a portion of the plot area. If Auto Scale is enabled, it will only trigger if current spare space exceeds this threshold.- Axis Color (
axis_x_axis_color) The color of this axis. Used for colorizing ticks, title and labels.
- Axis Title (
axis_x_axis_title) The title of this axis.
- Dash Grid Line (
axis_x_dash_grid_line) Whether to use a dashed line for the grid matching this axis. Otherwise solid.
- Grid Color (
axis_x_grid_color) The color of the grid matching this axis.
- Left/Bottom Side (
axis_x_left_bottom_side) If true this axis is shown on the left (Y axis) or bottom (X axis) side. If false this axis is shown on the right (Y axis) or to (X axis) side.
This property is only available for secondary axes (index > 1).
- Log Scale (
axis_x_log_scale) Use a logarithmic scale.
- Maximum (
axis_x_maximum) The upper bound the axis range.
- Minimum (
axis_x_minimum) The lower bound of the axis range.
- Scale Font (
axis_x_scale_font) The font used to render the scale labels.
- Scale Format (
axis_x_scale_format) The format used to render scale labels.
The pattern follows Java conventions. See https://docs.oracle.com/javase/7/docs/api/java/text/DecimalFormat.html
Some examples:
Value
Format
Printed
1234
#.00
1234.00
12.3456
#.##
12.35
1234
0.###E0
1.234E3
- Show Grid (
axis_x_show_grid) Whether to show a grid matching this axis.
- Time Format (
axis_x_time_format) The format used in case this axis should be used for showing time.
Code
Value
Description
0
None
This axis is not time-based (number formatting defined by Scale Format).
1
yyyy-MM-ddHH:mm:ss2
yyyy-MM-ddHH:mm:ss.SSS3
HH:mm:ss
4
HH:mm:ss.SSS
5
HH:mm
6
yyyy-MM-dd
7
MMMMM d
8
Auto
The format of the time label is automatically determined.
- Title Font (
axis_x_title_font) Font used for rendering the axis title.
- Visible (
axis_x_visible) Whether this axis is visible.
- Y Axis (
axis_x_y_axis) Whether this is an Y axis.
This property is only available for secondary axes (index > 1).
Trace Properties
The property names for the following properties take the form
trace_x_property_name, where x is the zero-based index of that trace.
- Anti Alias (
trace_x_anti_alias) Smoothen this trace.
- Buffer Size (
trace_x_buffer_size) Size of the FIFO buffer underlying this trace. When the buffer is full older items get deleted.
- Concatenate Data (
trace_x_concatenate) This property is only useful when using with array PVs. Leave it enabled for other PV types.
If yes, whenever the array PV is updated, all of the new array entries are appended to the existing trace data.
If no, whenever the array PV is updated, all of the new array entries replace all the existing trace data.
- Line Width (
trace_x_line_width) Thickness of the trace. If the Trace Type is set to
Bar, this signifies the bar width.- Name (
trace_x_name) Name of the trace, as visible in the legend.
- Plot Mode (
trace_x_plot_mode) Specifies what to do when the underlying buffer fills up.
Code
Value
Description
0
Plot last n pts.
Show the last updates, removing older points when buffer is full.
1
Plot n pts & stop.
Stop updating the plot when the buffer is full. No data gets removed from the buffer.
- Point Size (
trace_x_point_size) Size in pixels of points if Point Style is not set to
None.- Point Style (
trace_x_point_style) How to stylize data points.
Code
Value
0
None
1
Point
2
Circle
3
Filled Circle
4
Triangle
5
Filled Triangle
6
Square
7
Filled Square
8
Diamond
9
Filled Diamond
10
X Cross
11
Cross
12
Bar
- Trace Color (
trace_x_trace_color) Color of this trace.
- Trace Type (
trace_x_trace_type) Type of trace visualization.
Code
Value
0
Solid Line
1
Dash Line
2
Point
3
Bar
4
Area
5
Line Area
6
Step Vertically
7
Step Horizontally
8
Dash Dot Line
9
Dash Dot Dot Line
10
Dot Line
- Update Delay (
trace_x_update_delay) Throttle plot updates by the given amount of milliseconds. In case of multiple traces, the shortest update time takes precedence.
- Update Mode (
trace_x_update_mode) Specify when PV updates should be added to the FIFO buffer underlying this trace.
Code
Value
Description
0
X or Y
Update the buffer whenever the X PV or the Y PV has changed. No received data will be missed with this mode.
1
X and Y
Update the buffer only as soon as both the X PV and the Y PV have received an update. Only the last value for each is added to the buffer, so it is possible to miss some values with this mode.
2
X
Update the buffer whenever the X PV has changed. Data coming from the Y PV may be missed with this mode (for example because Y PV updates faster than X PV).
3
Y
Update the buffer whenever the Y PV has changed. Data coming from the X PV may be missed with this mode (for example because X PV updates faster than Y PV).
4
Trigger
Update the buffer only whenever the Trigger PV has changed. This is one of the graph properties shared between all traces. Data coming from both the X PV and the Y PV maybe be missed with this mode (for example because they update faster than the trigger PV).
- Visible (
trace_x_visible) Whether this trace should be visible.
- X Axis Index (
trace_x_x_axis_index) Index of the axis that is X axis of this trace.
- X PV (
trace_x_x_pv) The PV providing x values. If empty, this trace is assumed to be chronological.
- Y Axis Index (
trace_x_y_axis_index) Index of the axis that is Y axis of this trace.
- Y PV (
trace_x_y_pv) The PV providing y values. By default this is set to the macro
$(pv_name)so that a user can more simply populate only the PV Name field, as the common use case is to render plots with only one X and Y axis.
Additional API
XY Graph widgets expose the following additional Widget API for use in scripting:
- clearGraph()
Clear the graph (deletes trace buffers).
- getXBuffer( trace )
Returns the current X axis values for the given trace index as an array of doubles.
- getYBuffer( trace )
Returns the current Y axis values for the given trace index as an array of doubles.