
Intensity Graph
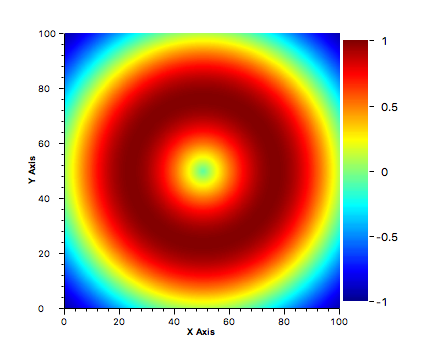
Widget that displays an array of numbers as an image. An Intensity Graph could be used to display a video image, temperature pattern or terrain.
An Intensity Graph can be used in two different modes toggled by the property RGB Mode:
When not in RGB mode, this widget uses a configurable color map that associates a color with each possible array entry value.
The input data must then be provided as a single dimensioned array where rows are concatenated to each other. For example, consider the following one-dimensional input data:
[p1,1, p1,2, …, p1,y , p2,1, p2,2, …, p2,y , …, px,1, px,2, …, px,y]
The widget will interpret this data as a two-dimensional array with
xrows andycolumns:[ p1,1, p1,2, …, p1,y ][ p2,1, p2,2, …, p2,y ]…[ px,1, px,2, …, px,y ]When in RGB Mode, the input data is again a one-dimensional array of values, but the number of elements (Data Height times Data Width) must be multiplied by three for describing the red, green and blue values of each pixel. The structure of the data is similar as when using a color map, but each pixel is described by three values: red, green and blue.
[p1,1,r, p1,1,g, p1,1,b , …, px,y,r, px,y,g, px,y,b]
This widget also allows connecting PVs that will receive updates with the profile data matching the input.
Basic Properties
- Horizon Profile X PV (
horizon_profile_x_pv_name) The output PV which will receive updates with the horizontal profile data on the X axis.
- Horizon Profile Y PV (
horizon_profile_y_pv_name) The output PV which will receive updates with the horizontal profile data on the Y axis.
- Name (
name) Human-readable name of this widget. Shown in the Outline view.
- Pixel Info PV (
pixel_info_pv_name) The output PV which will receive updates when the user hovers the graph, or clicks on it. Each such event is sent as as a
VTableto the PV.The
VTablehas the following columns:X: X coordinate of the pixel.Y: Y coordinate of the pixel.Value: Value of the image data for this specific pixel.Selected: True if the user was pressing the mouse button. False otherwise.
- PV Name (
pv_name) The name of the main PV for this widget. If set, the widget’s value follows value updates of the corresponding PV.
It is not a requirement to use a PV. You may also control the widget value directly through scripting.
- Vertical Profile X PV (
vertical_profile_x_pv_name) The output PV which will receives updates with the vertical profile data on the X axis.
- Vertical Profile Y PV (
vertical_profile_y_pv_name) The output PV which will receives updates with the vertical profile data on the Y axis.
- Widget Type (
widget_type) Readonly property describing the type of this widget.
Behavior Properties
- Actions (
actions) Executable Actions attached to this widget.
- Crop Bottom (
crop_bottom) Amount of pixels to be cropped from the bottom of the image.
- Crop Left (
crop_left) Amount of pixels to be cropped from the left of the image.
- Crop Right (
crop_right) Amount of pixels to be cropped from the right of the image.
- Crop Top (
crop_top) Amount of pixels to be cropped from the top of the image.
- Data Height (
data_height) Number of rows of the input data.
- Data Width (
data_width) Number of rows of the input data.
- Enabled (
enabled) Unset to make this control widget unusable.
- Maximum (
maximum) The upper limit for a singular array element.
- Minimum (
minimum) The lower limit for a singular array element.
- Profile on Single Line (
single_line_profiling) If set, profile on a single pixel. A horizontal and vertical guideline is added to the graph. These can be dragged around.
If unset, the profiling is performed on the average of all pixels.
- RGB Mode (
rgb_mode) Enable RGB mode. In this mode, the color map is not available, and RGB values for each pixel must be provided.
Profiles take the average of r, g and b for each point.
- ROI Count (
roi_count) The number of regions of interest.
Regions of interest are marked on the graph. For each region of interest a specific set of properties is added as detailed in ROI Properties.
- Rules (
rules) Rules attached to this widget.
- Scripts (
scripts) Scripts attached to this widget.
- Visible (
visible) Manage the visibility of this widget.
Border Properties
- Alarm Sensitive (
border_alarm_sensitive) If the PV is in alarm state, the widget border and style change to alarm mode.
- Border Color (
border_color) The color of the widget border.
Has no meaning with certain types of border styles (for example, raised borders have a fixed style).
- Border Style (
border_style) The type of border. Some border styles also colorize the background of the widget’s bounding box.
- Border Width (
border_width) The thickness of the widget border.
Has no meaning with certain types of border styles (for example, raised borders have a fixed style).
Display Properties
- Alarm Pulsing (
alarm_pulsing) If enabled, the PV is in alarm state, and the properties BackColor Alarm Sensitive and/or ForeColor Alarm Sensitive are used, then the corresponding colors will fade in and out to draw operator’s attention.
- BackColor Alarm Sensitive (
backcolor_alarm_sensitive) If the PV is in alarm state, then Background Color matches the corresponding alarm color.
- Background Color (
background_color) The color of the background of the widget’s bounding box. Only visible when the widget uses a border style that fills up the widget area.
- Color Map (
color_map) Color map for the graph. This maps values to colors. In the dialog you can choose from a set of predefined color maps (defaulting to JET) or make one yourself.
If the option Interpolate is selected, the color mapping will be done through linear interpolation of the colors available in the map.
If the option Auto Scale is selected, the value range of the color map is remapped to the range indicated by the properties Minimum and Maximum. If unselected, there is no remapping, and the lookup is direct.
Note
This property has multiple sub-properties. Use in scripts and rules is limited to switching between the predefined maps: GrayScale, JET, ColorSpectrum, Hot, Cool or Shaded.
widget.setPropertyValue("color_map", "JET");
When doing so the other sub-properties (interpolate, autoscale) default to true.
- Font (
font) The font of the label.
- ForeColor Alarm Sensitive (
forecolor_alarm_sensitive) If the PV is in alarm state, then Foreground Color matches the corresponding alarm color.
- Foreground Color (
foreground_color) The color of the label.
- ROI Color (
roi_color) The color of the frame for indicating a region of interest.
- Show Ramp (
show_ramp) Whether to show the color map legend to the right of the graph.
- Tooltip (
tooltip) Tooltip when mouse hovers this widget.
Position Properties
- Graph Area Height (
graph_area_height) The height of the actual graph area. The widget size will adjust accordingly.
- Graph Area Width (
graph_area_width) The width of the actual graph area. The widget size will adjust accordingly.
- Height (
height) Height of the widget area in pixels.
- Scale Options (
scale_options) If autoscaling is enabled on the Display, then this property allows controlling whether and how this widget participates.
- Width (
width) Width of the widget area in pixels
- X (
x) X-coordinate in pixels of the top-left corner of the widget area.
- Y (
y) Y-coordinate in pixels of the top-left corner of the widget area.
ROI Properties
The property names for the following properties take the form
roi_x_property_name, where x is the zero-based index of that ROI.
- Height PV (
roi_x_height_pv) PV that provides the height of the ROI.
- Title (
roi_x_title) The label for this ROI, as shown on the graph.
- Visible (
roi_x_visible) Whether this ROI is visible on the graph.
- Width PV (
roi_x_width_pv) PV that provides the width of the ROI.
- X PV (
roi_x_x_pv) PV that provides the X coordinate of the ROI.
- Y PV (
roi_x_y_pv) PV that provides the Y coordinate of the ROI.
X Axis Properties
- Axis Color (
x_axis_axis_color) Color used for rendering X axis ticks and labels.
- Axis Title (
x_axis_axis_title) Label for the X axis.
- Major Tick Step Hint (
x_axis_major_tick_step_hint) The minimum space in pixels between major ticks.
- Maximum (
x_axis_maximum) Upper range of the axis.
- Minimum (
x_axis_minimum) Lower range of the axis.
- Scale Font (
x_axis_scale_font) Font used for axis labels.
- Show Minor Ticks (
x_axis_show_minor_ticks) Whether to show minor ticks on the scale.
- Title Font (
x_axis_title_font) Font used for the axis title.
- Visible (
x_axis_visible) Whether to show the X axis.
Y Axis Properties
- Axis Color (
y_axis_axis_color) Color used for rendering Y axis ticks and labels.
- Axis Title (
y_axis_axis_title) Label for the Y axis.
- Major Tick Step Hint (
y_axis_major_tick_step_hint) The minimum space in pixels between major ticks.
- Maximum (
y_axis_maximum) Upper range of the axis.
- Minimum (
y_axis_minimum) Lower range of the axis.
- Scale Font (
y_axis_scale_font) Font used for axis labels.
- Show Minor Ticks (
y_axis_show_minor_ticks) Whether to show minor ticks on the scale.
- Title Font (
y_axis_title_font) Font used for the axis title.
- Visible (
y_axis_visible) Whether to show the Y axis.